PQube 3 meter · Treasure Island · Live instrument log

Power Quality

Every voltage sag, swell, transient, and interruption recorded by the island's power-quality meter, published as it happens. These are real instrument readings, not estimates and not outage reports. A brief sag is logged here as a sag, never as an outage.

Latest event
Voltage Sag · Thu, Oct 22, 2026, 4:05:46 AM PDT
Deepest dip
0.00% of nominal · Thu, Nov 23, 2023, 4:01:22 PM PST
Events logged
4
Monitor
Watching

Why this matters

Why a public meter matters

Outage logs can't see what breaks your equipment. On September 12, 2023, this meter recorded a voltage sag to 0.03% of nominal for 1.8 seconds — deep enough to trip equipment on site. Two days later, SFPUC's official word was that there were “no outages” that day. Both statements were true: outage logs track sustained service loss, not the brief voltage collapses that destroy appliances. Without a power-quality meter, that event officially never happened.

The meter is the only precise public record. In October 2021, island residents told the Board of Supervisors about 6+ hour outages and repeated brownouts. This meter's charts confirmed their account almost exactly: a 6.6-hour outage on October 24, a 32-minute outage on October 27, and six voltage sags that month. Without the instrument, those events are anecdotes; with it, they're evidence.

It's cheap — and the city already agreed. A voltage-only PQube 3 monitor lists at $3,014; the full power analyzer at about $4,837. Five monitoring points across the island's feeders is roughly $15,000–$25,000 one time, with near-zero operating cost — the meter emails its own reports around the clock. SFPUC ordered a monitor for the main island feed in August 2023 and added one to its budget that October. The remaining step is making the data public.

If you felt a flicker or lost power, report the outage so it can be matched against the instrument record.

InterruptionDirect link

Voltage remaining

0.00%

of nominal voltage

Duration

1.96 s

Trigger channel
L1-N
Trigger threshold
10.0% of nominal
Nominal
120 / 208 V
Meter
P3001520

Voltage dropped to near zero: a genuine loss of power for the duration measured.
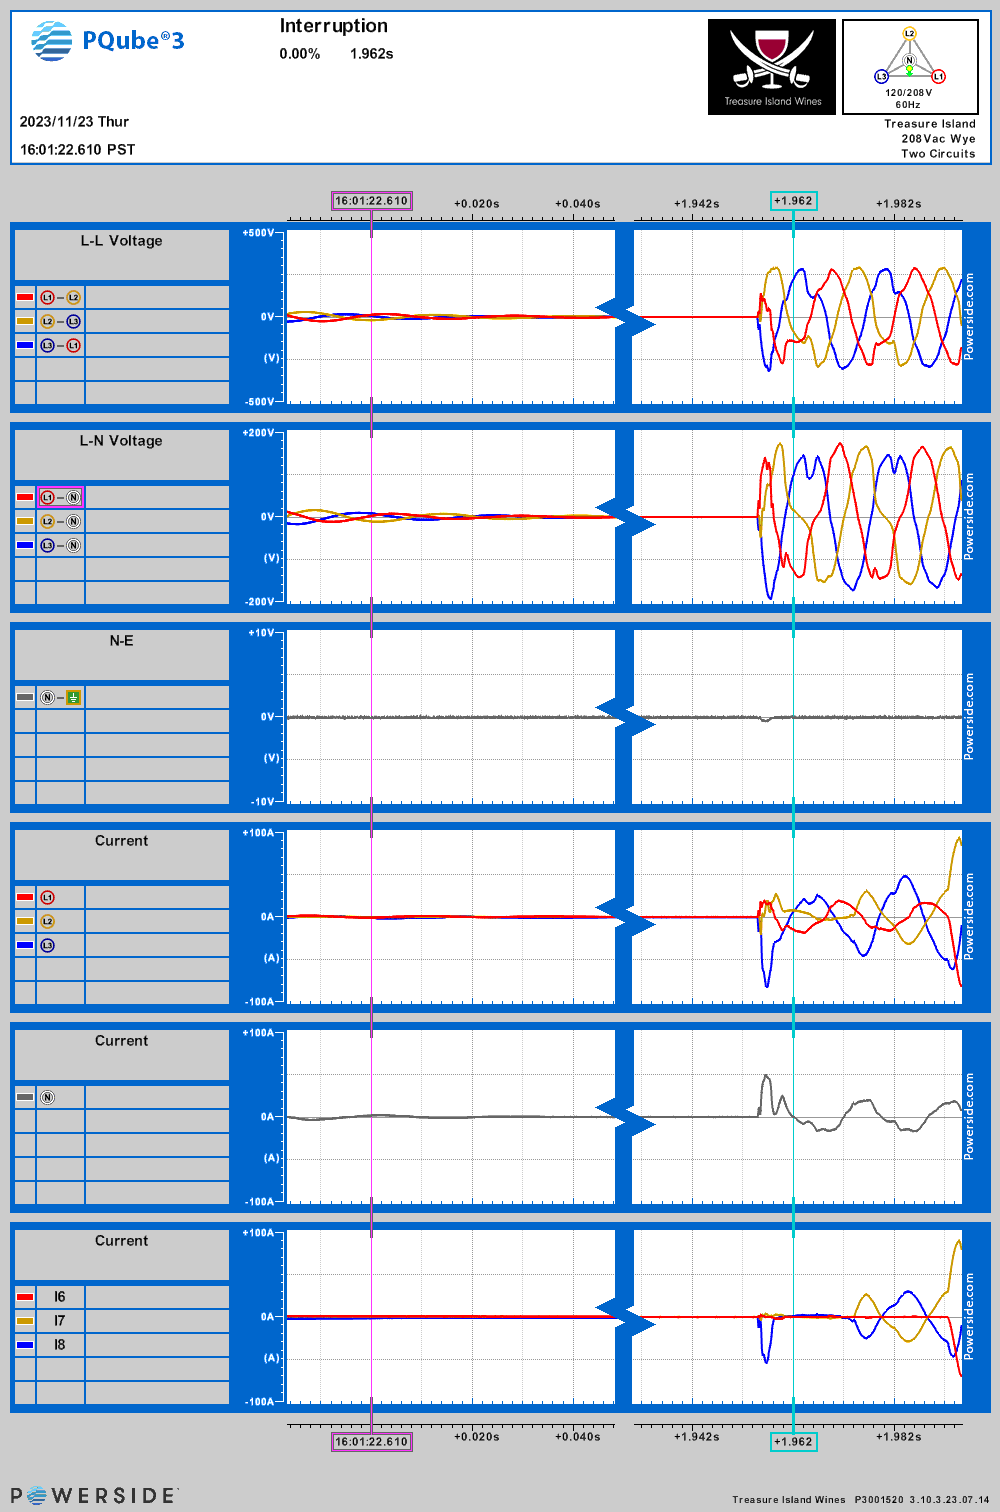
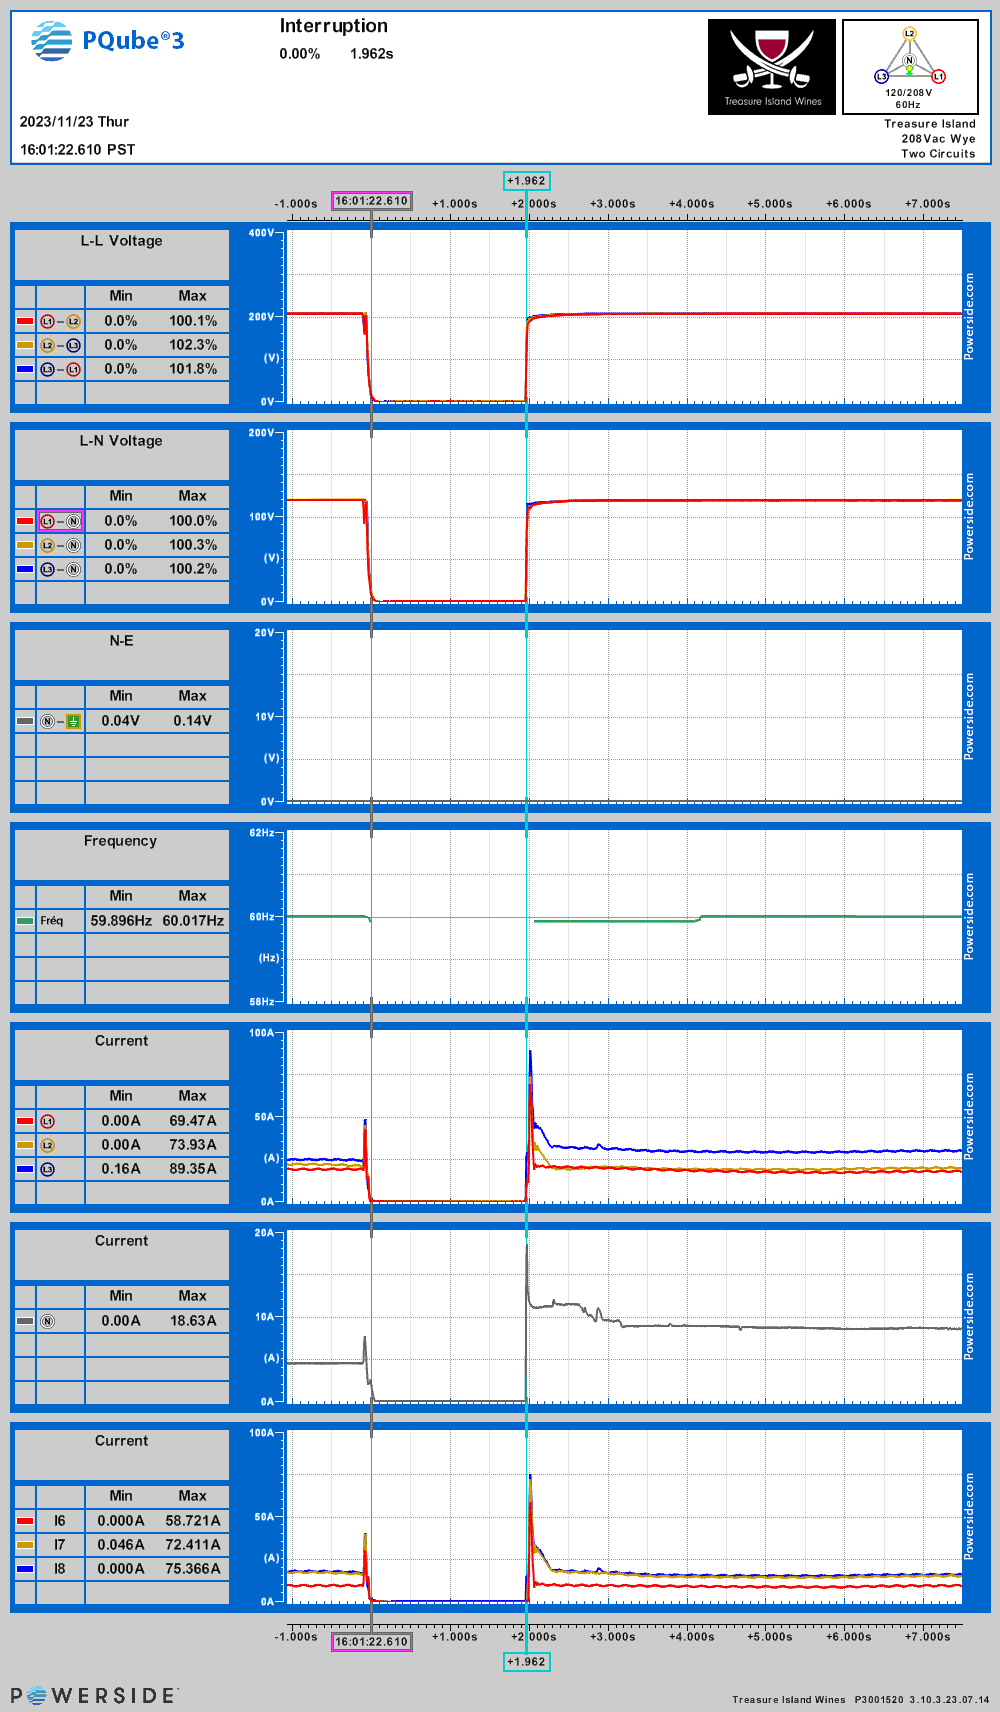
Oscilloscope waveform captured during the interruption on Thu, Nov 23, 2023, 4:01:22 PM PST
WAVEFORM CAPTURED BY THE METER · TAP TO VIEW FULL SIZE
RMS plot and per-channel readings
RMS voltage plot for the interruption on Thu, Nov 23, 2023, 4:01:22 PM PST
Min / max readings (full window and event-only)
ChannelMinMaxMin (event)Max (event)
N-E0.04V0.14V0.04V0.14V
L1-N0.0V120.0V0.0V60.5V
L2-N0.0V120.3V0.0V47.7V
L3-N0.0V120.2V0.0V23.0V
L1-L20.0V208.2V0.0V99.4V
L2-L30.0V212.8V0.0V127.4V
L3-L10.0V211.7V0.0V117.1V
L1Amp0.00A69.47A0.00A
L2Amp0.00A73.93A0.00A
L3Amp0.16A89.35A0.16A
NAmp0.00A18.63A0.00A
L6Amp0.000A58.721A0.000A
L7Amp0.046A72.411A0.046A
L8Amp0.000A75.366A0.000A
Frequency59.896Hz60.017Hz59.901Hz59.901Hz
Power-0.121kW22.426kW-0.004kW2.804kW
JimMirowskiTreasureIslandWines
TastingRoom(Est2007)www.tiwines.com
InterruptionDirect link

Voltage remaining

0.00%

of nominal voltage

Duration

1.93 s

Trigger channel
Not recorded
Trigger threshold
10.0% of nominal
Nominal
120 / 208 V
Meter
P3001520

Voltage dropped to near zero: a genuine loss of power for the duration measured.

InterruptionDirect link

Voltage remaining

0.00%

of nominal voltage

Duration

32.0 min

Trigger channel
Not recorded
Trigger threshold
10.0% of nominal
Nominal
120 / 208 V
Meter
P3001520

Voltage dropped to near zero: a genuine loss of power for the duration measured.

InterruptionDirect link

Voltage remaining

0.00%

of nominal voltage

Duration

393.8 min

Trigger channel
Not recorded
Trigger threshold
10.0% of nominal
Nominal
120 / 208 V
Meter
P3001520

Voltage dropped to near zero: a genuine loss of power for the duration measured.

PQube 3 meter · Monthly trend reports

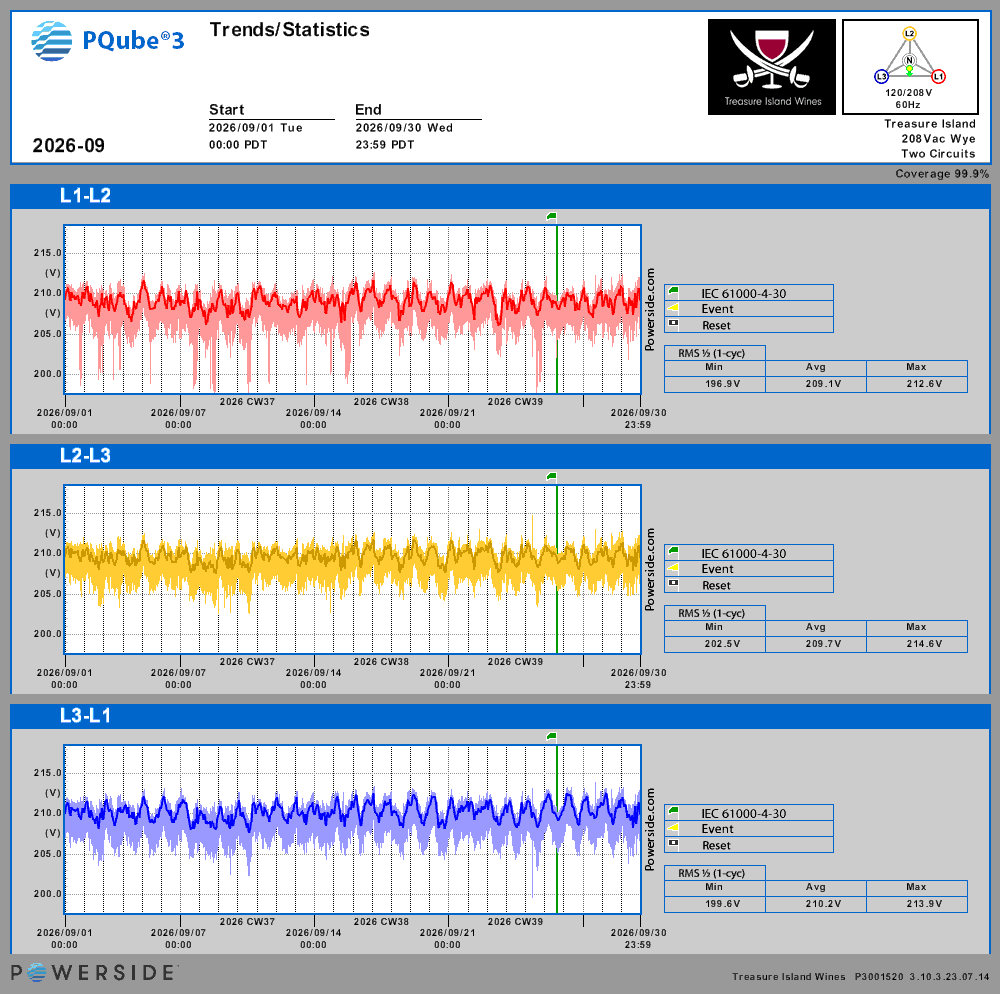
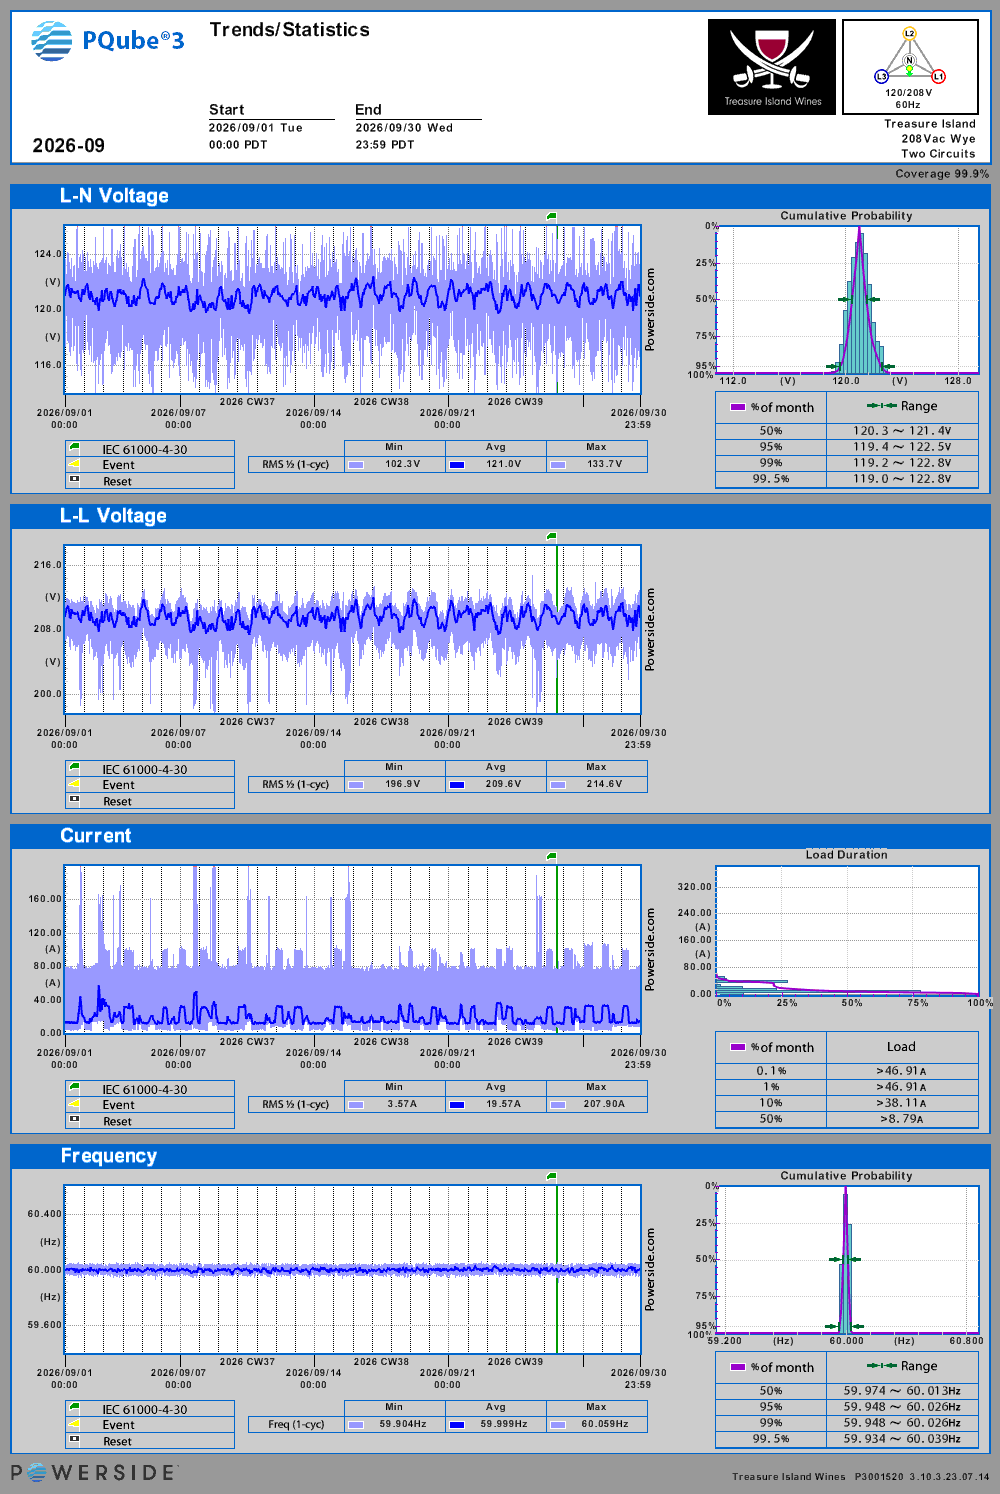
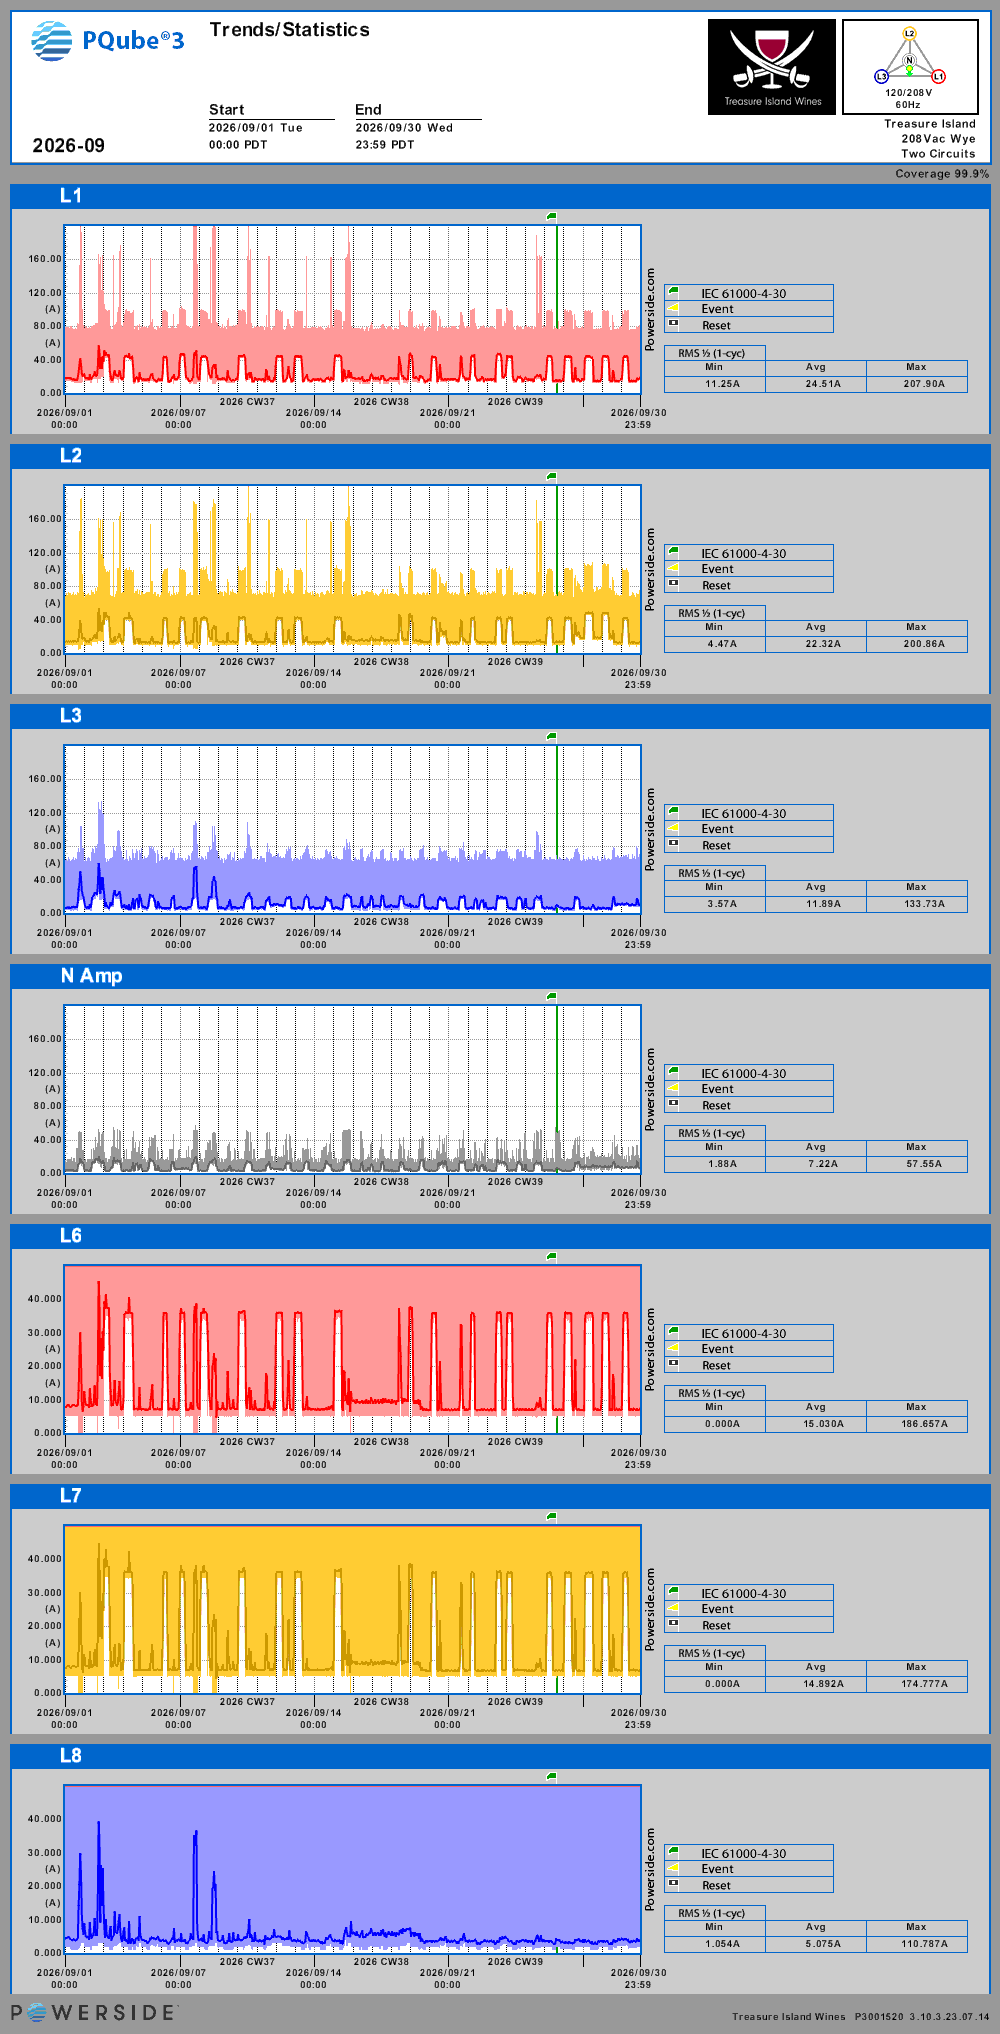
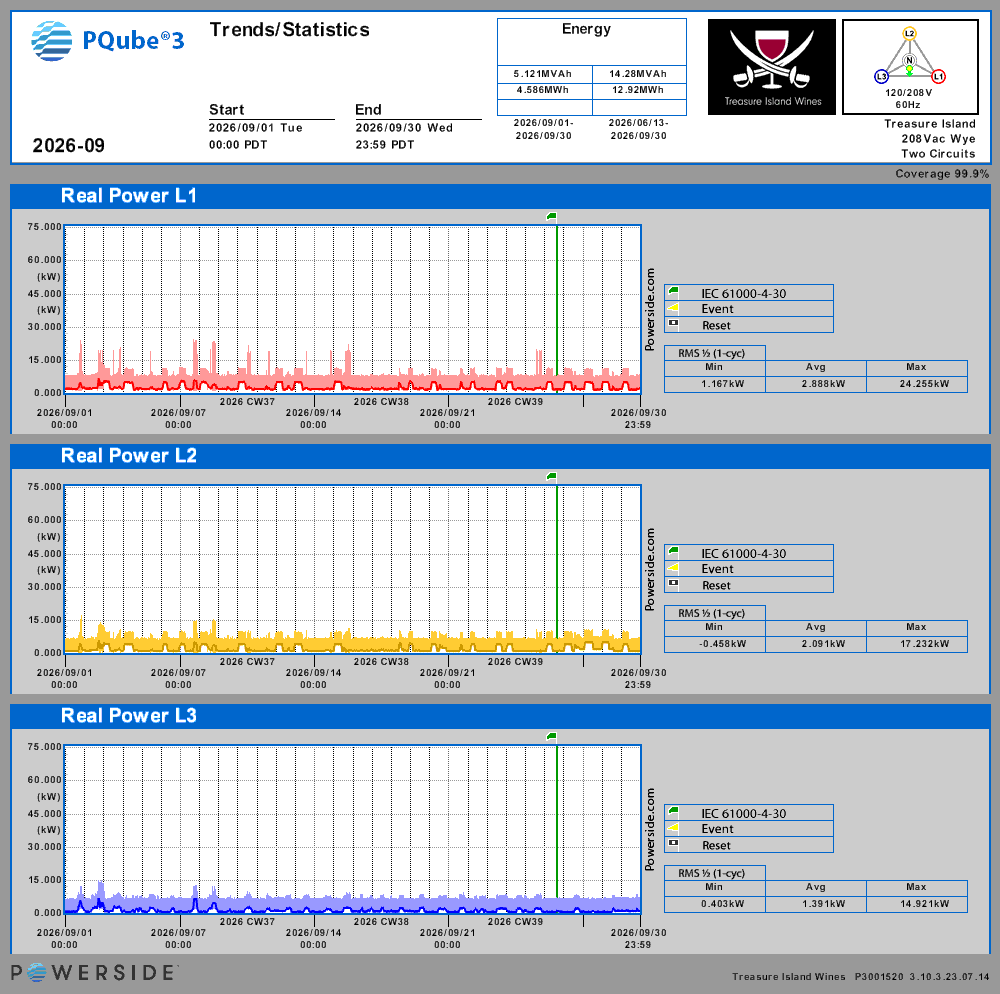
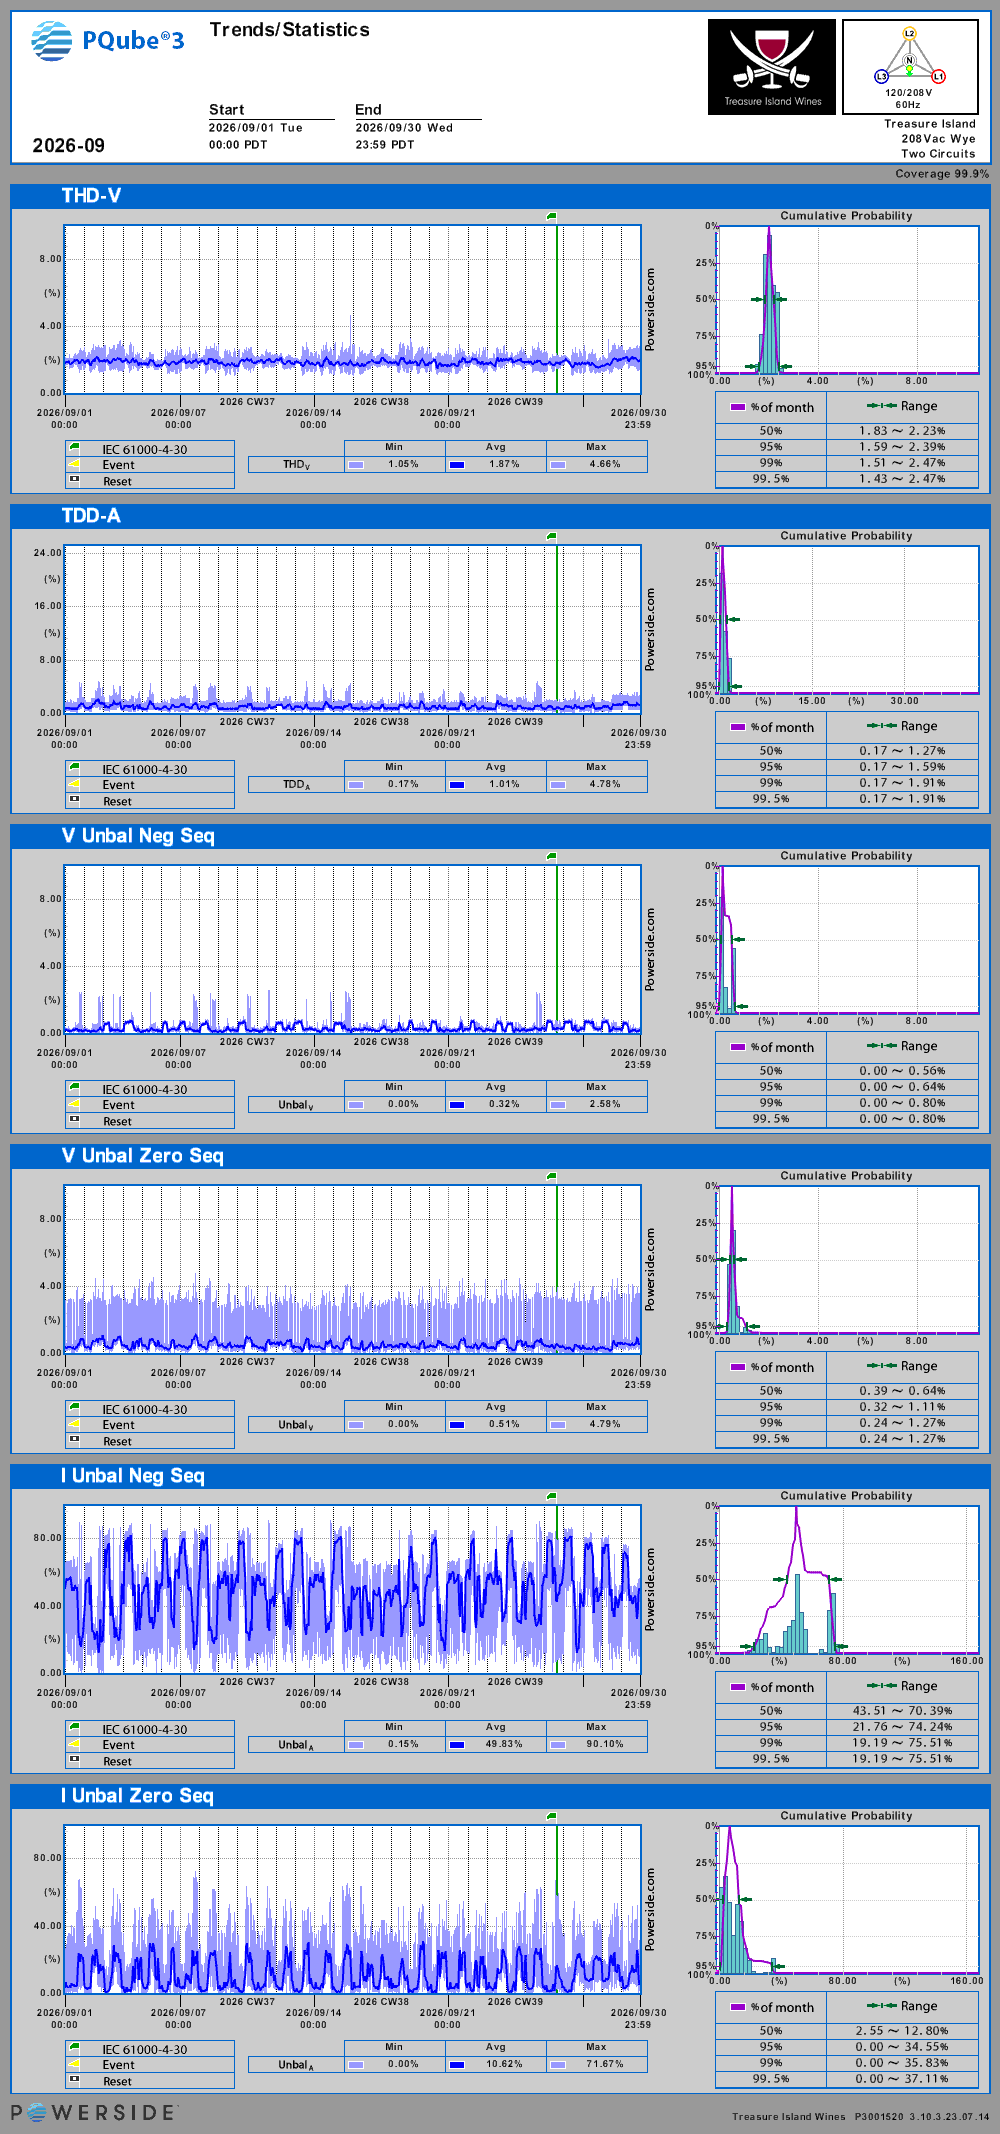
Month-long statistical summaries from the same meter — minimum, average, and maximum for each measured channel, plus the meter's own trend charts. These are summaries, not events: a rough month here means consistently poor power quality, while the event log above records individual disturbances.

September 2026 summary

100% coverage

PQube 3 · Serial P3001520 · Treasure Island Wines · PDT

Line-to-neutral · min/avg/max
102.3V / 121.0V / 133.7V
Line-to-line · min/avg/max
196.9V / 209.6V / 214.6V
Frequency · min/avg/max
59.904Hz / 59.999Hz / 60.059Hz
Voltage THD · min/avg/max
1.05% / 1.87% / 4.66%
Energy this month
4.586MWh
Apparent energy this month
5.121MVAh

Trend charts

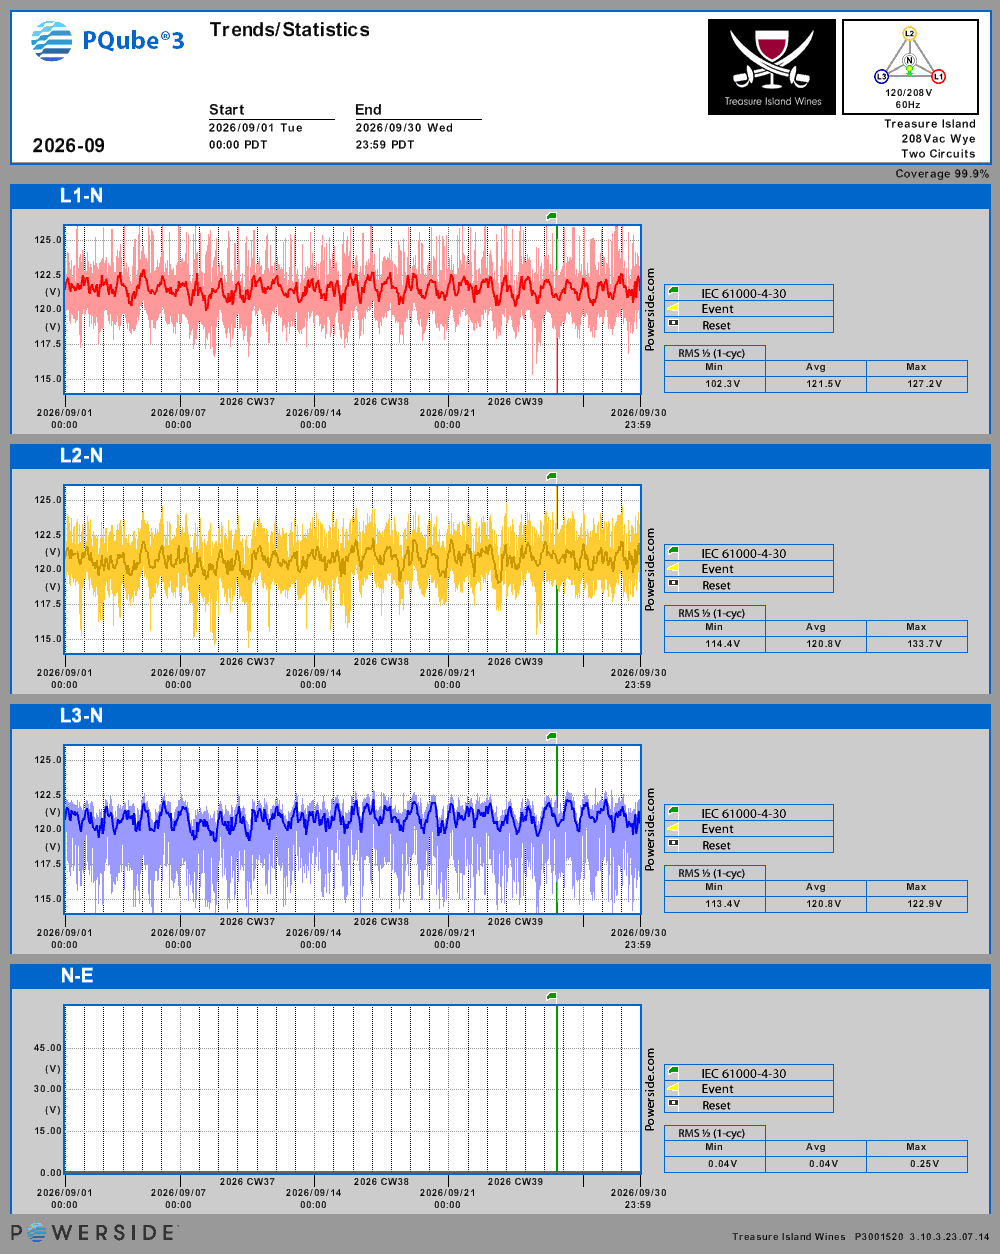
Line-to-neutral voltages — September 2026
Line-to-neutral voltages
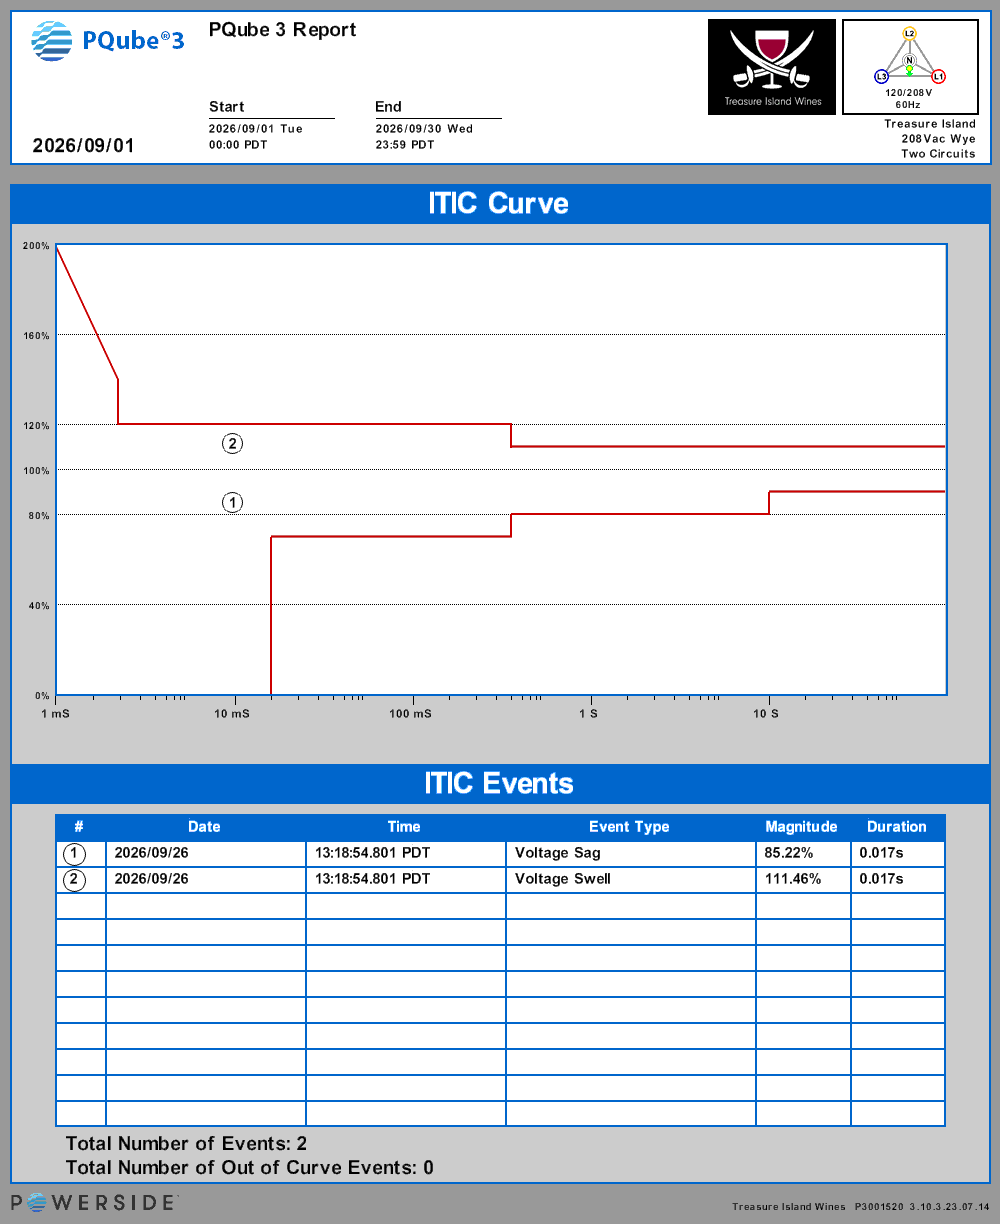
ITIC curve — event magnitudes vs. duration — September 2026
ITIC curve — event magnitudes vs. duration
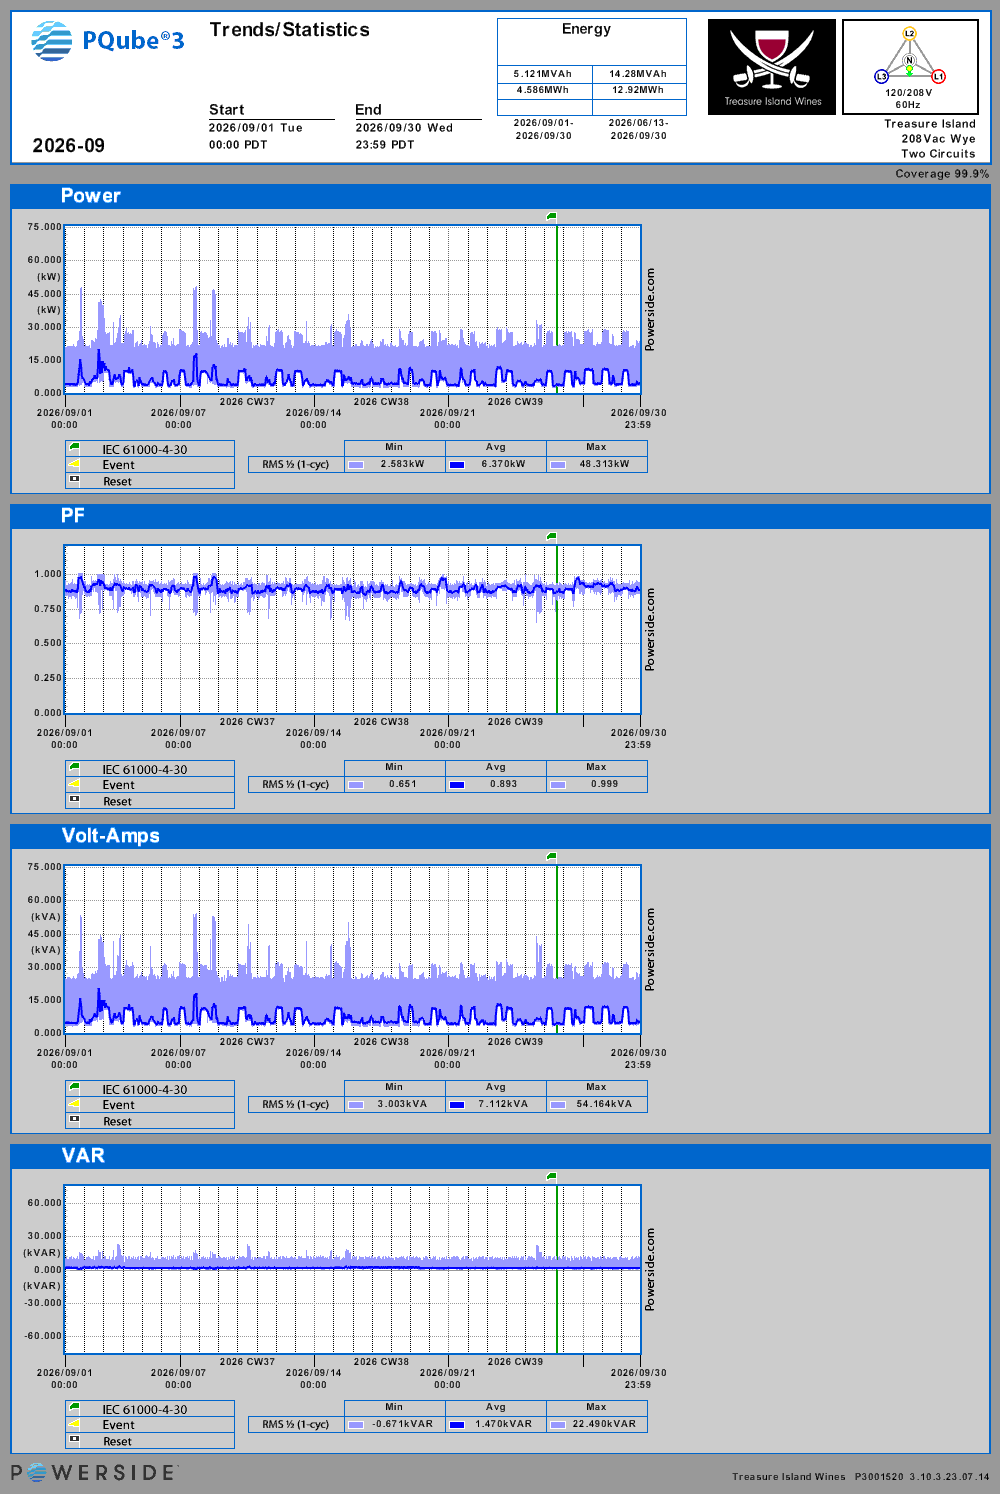
Power trends — September 2026
Power trends
Line-to-line voltages — September 2026
Line-to-line voltages
Voltage and current trends — September 2026
Voltage and current trends
Per-circuit current trends — September 2026
Per-circuit current trends
Per-circuit power trends — September 2026
Per-circuit power trends
THD and unbalance trends — September 2026
THD and unbalance trends
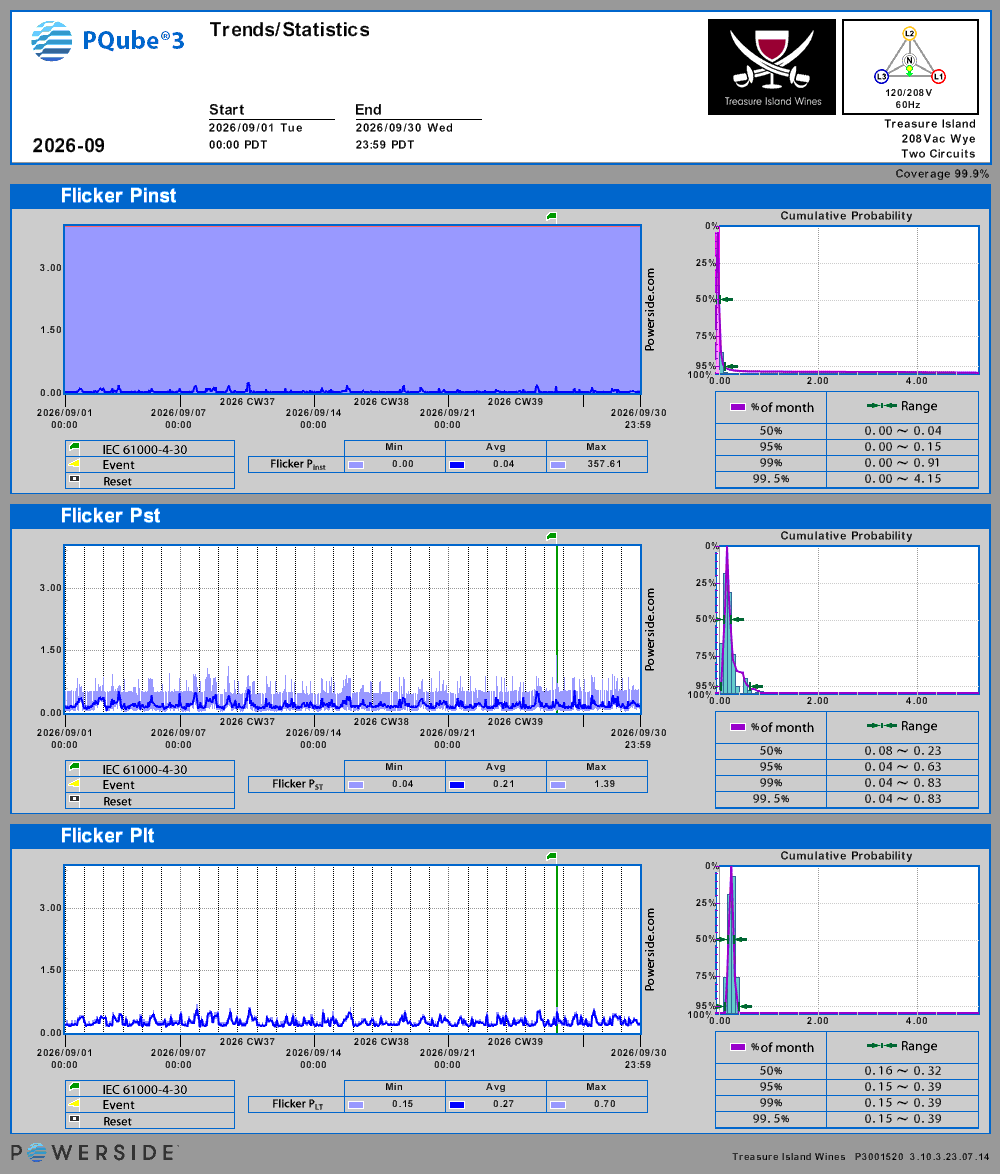
Flicker trends — September 2026
Flicker trends
All 49 channels — min / avg / max
ChannelMinAvgMax
L-N RMS 1/2 (1-cyc)102.3V121.0V133.7V
L1-N RMS 1/2 (1-cyc)102.3V121.5V127.2V
L2-N RMS 1/2 (1-cyc)114.4V120.8V133.7V
L3-N RMS 1/2 (1-cyc)113.4V120.8V122.9V
N-E RMS 1/2 (1-cyc)0.04V0.04V0.25V
L-L RMS 1/2 (1-cyc)196.9V209.6V214.6V
L1-L2 RMS 1/2 (1-cyc)196.9V209.1V212.6V
L2-L3 RMS 1/2 (1-cyc)202.5V209.7V214.6V
L3-L1 RMS 1/2 (1-cyc)199.6V210.2V213.9V
Current RMS 1/2 (1-cyc)3.57A19.57A207.90A
L1 Current RMS 1/2 (1-cyc)11.25A24.51A207.90A
L2 Current RMS 1/2 (1-cyc)4.47A22.32A200.86A
L3 Current RMS 1/2 (1-cyc)3.57A11.89A133.73A
N Current RMS 1/2 (1-cyc)1.88A7.22A57.55A
L6 Current RMS 1/2 (1-cyc)0.000A15.030A186.657A
L7 Current RMS 1/2 (1-cyc)0.000A14.892A174.777A
L8 Current RMS 1/2 (1-cyc)1.054A5.075A110.787A
Frequency (1-cyc)59.904Hz59.999Hz60.059Hz
V Unbal Neg Seq0.00%0.32%2.58%
V Unbal Zero Seq0.00%0.51%4.79%
I Unbal Neg Seq0.15%49.83%90.10%
I Unbal Zero Seq0.00%10.62%71.67%
THD-V1.05%1.87%4.66%
THD-V L1-N1.14%1.84%3.35%
THD-V L2-N1.05%1.80%4.66%
THD-V L3-N1.23%1.99%3.77%
TDD-A0.17%1.01%4.78%
TDD-A L10.41%1.21%4.78%
TDD-A L20.31%0.90%4.78%
TDD-A L30.17%0.94%4.03%
Flicker Pinst0.000.04357.61
Flicker Pst0.040.211.39
Flicker Plt0.150.270.70
Apparent Power3.003kVA7.112kVA54.164kVA
Apparent Power L11.186kVA2.981kVA24.369kVA
Apparent Power L20.537kVA2.695kVA23.340kVA
Apparent Power L30.429kVA1.436kVA15.303kVA
Reactive Power-0.671kVAR1.470kVAR22.490kVAR
Reactive Power L1-2.740kVAR-0.159kVAR7.162kVAR
Reactive Power L2-0.596kVAR1.634kVAR16.289kVAR
Reactive Power L3-1.345kVAR-0.005kVAR7.259kVAR
Real Power2.583kW6.370kW48.313kW
Real Power L11.167kW2.888kW24.255kW
Real Power L2-0.458kW2.091kW17.232kW
Real Power L30.403kW1.391kW14.921kW
PF0.6510.8930.999
PF L10.7260.9811.000
PF L20.0460.7380.999
PF L30.5490.9801.000

PQube 3 meter · Weekly trend reports

Week-long statistical summaries from the same meter — minimum, average, and maximum for each measured channel. Below each week's numbers are the individual events from the log above that happened during that week, so a rough week can be matched to what the meter actually caught.

Week 45, 2026 summary

2026-11-02 – 2026-11-08 · 100% coverage

PQube 3 · Serial P3001520 · Treasure Island Wines · PST

Line-to-neutral · min/avg/max
67.3V / 121.6V / 127.1V
Line-to-line · min/avg/max
116.9V / 210.6V / 214.3V
Frequency · min/avg/max
59.939Hz / 59.999Hz / 60.069Hz
Voltage THD · min/avg/max
1.12% / 1.81% / 3.44%
Energy this week
650.2kWh
Apparent energy this week
710.5kVAh

Outages & events this week (0)

No sags, swells, transients, or interruptions logged during this week.

All 49 channels — min / avg / max
ChannelMinAvgMax
L-N RMS 1/2 (1-cyc)67.3V121.6V127.1V
L1-N RMS 1/2 (1-cyc)68.9V121.9V127.1V
L2-N RMS 1/2 (1-cyc)67.3V121.7V125.0V
L3-N RMS 1/2 (1-cyc)68.4V121.2V122.9V
N-E RMS 1/2 (1-cyc)0.04V0.04V0.21V
L-L RMS 1/2 (1-cyc)116.9V210.6V214.3V
L1-L2 RMS 1/2 (1-cyc)116.9V210.2V212.8V
L2-L3 RMS 1/2 (1-cyc)117.0V210.6V214.3V
L3-L1 RMS 1/2 (1-cyc)120.8V211.1V213.2V
Current RMS 1/2 (1-cyc)1.90A11.57A80.60A
L1 Current RMS 1/2 (1-cyc)6.96A17.21A80.60A
L2 Current RMS 1/2 (1-cyc)1.90A11.20A58.15A
L3 Current RMS 1/2 (1-cyc)2.59A6.28A49.42A
N Current RMS 1/2 (1-cyc)2.02A6.21A61.47A
L6 Current RMS 1/2 (1-cyc)0.000A4.617A30.850A
L7 Current RMS 1/2 (1-cyc)0.046A4.582A30.621A
L8 Current RMS 1/2 (1-cyc)0.493A2.073A31.549A
Frequency (1-cyc)59.939Hz59.999Hz60.069Hz
V Unbal Neg Seq0.00%0.24%1.14%
V Unbal Zero Seq0.01%0.54%4.56%
I Unbal Neg Seq1.06%54.34%88.67%
I Unbal Zero Seq0.06%16.61%78.94%
THD-V1.12%1.81%3.44%
THD-V L1-N1.18%1.78%2.93%
THD-V L2-N1.12%1.79%3.19%
THD-V L3-N1.25%1.87%3.44%
TDD-A0.17%0.64%3.03%
TDD-A L10.31%0.69%2.36%
TDD-A L20.36%0.61%2.51%
TDD-A L30.17%0.64%3.03%
Flicker Pinst0.000.044947.73
Flicker Pst0.040.175.35
Flicker Plt0.090.282.34
Apparent Power1.383kVA4.229kVA15.731kVA
Apparent Power L10.787kVA2.100kVA9.536kVA
Apparent Power L20.221kVA1.364kVA6.983kVA
Apparent Power L30.230kVA0.765kVA5.801kVA
Reactive Power-0.948kVAR0.463kVAR3.490kVAR
Reactive Power L1-2.017kVAR-0.164kVAR3.023kVAR
Reactive Power L20.053kVAR0.760kVAR3.006kVAR
Reactive Power L3-1.397kVAR-0.133kVAR1.816kVAR
Real Power1.269kW3.870kW14.611kW
Real Power L10.786kW2.035kW9.318kW
Real Power L20.130kW1.106kW6.372kW
Real Power L30.212kW0.730kW5.604kW
PF0.7500.9260.995
PF L10.7490.9851.000
PF L20.5880.7840.988
PF L30.5030.9740.999

How this log works

A Powerside PQube 3 power-quality meter (serial P3001520) installed at Treasure Island Wines monitors the island's 208 V three-phase service around the clock. When voltage moves outside its configured thresholds, the meter emails an event report with oscilloscope waveforms, and this page publishes it automatically.

Event categories are kept separate on purpose. A voltage sag is a dip that the lights ride through; an interruption means voltage fell to near zero. Conflating the two would inflate outage counts, so this log never does.

The meter is operated by Treasure Island Wines, which forwarded its event alerts to this project for publication as a public power-quality record. If you felt a flicker or lost power, report the outage so it can be matched against the instrument record.